
Your cart is currently empty!
The Truth About Dollar Cost Averaging vs Market Timing (And Which One Wins)
Posted by:
|
On:
|
Introduction: The Most Important Part of Investing
When investing in the stock market, the most important thing is getting money into the market. There are two basic strategies that investors typically use: dollar cost averaging (DCA) and market timing.
Two Basic Investment Strategies
What is Dollar Cost Averaging (DCA)?
Dollar cost averaging simply means putting a fixed amount of money into the market on a regular basis, regardless of what the market is doing. A common method — and the one I personally use — is investing a set amount at the beginning of each month, no matter what.
What is Market Timing?
Market timing, on the other hand, involves trying to invest at the lowest points of the market to get the highest returns. Unfortunately, none of us have a crystal ball, so predicting the future is almost impossible.
That said, there are a few tools we can use to get a sense of whether the market is overvalued or undervalued. One of the simplest is the Shiller price-to-earnings (P/E) ratio.
How We Measure Market Valuation
Understanding the P/E Ratio
In the stock market, the P/E ratio is a quick way to measure valuation — comparing a business’s stock price to its earnings.
For example, Tesla is currently trading at a P/E ratio of 142, compared to a P/E ratio of 38 in 2022. From this, we can see Tesla is more expensive now than it was in 2022.
The P/E ratio is calculated by taking the market cap (share price × shares outstanding) and dividing it by the company’s earnings. In simple terms, it tells us how much investors are paying for every dollar of earnings. So if a company has a P/E of 15, investors are paying $15 for every $1 of earnings.
How the Shiller P/E Ratio (CAPE) Works
The Shiller P/E ratio — also called the Cyclically Adjusted Price-to-Earnings ratio (CAPE) — works similarly but is applied to the entire S&P 500 index. Instead of using just one year of earnings, it uses the 10-year inflation-adjusted average of earnings.
Developed by economist Robert Shiller, this ratio helps smooth out short-term fluctuations and gives a clearer long-term view.
Historically, the average Shiller P/E for the S&P 500 has been about 17.04. Generally, the market is considered overvalued above 20. In the last 25 years, the S&P 500 has only dipped below 20 during the Great Recession.
Testing Three Investment Strategies: A 25-Year Case Study
The Setup: $100 a Month Into the S&P 500
I decided to test three different strategies using real data.
In each model, we assume an investor sets aside $100 per month from January 2000 to April 2025, directly into the S&P 500.
Here’s how the strategies worked:
- Portfolio 1 (DCA): Invest $100 at the beginning of each month.
- Portfolio 2 (P/E < 30): Only invest $100 if the Shiller P/E is below 30. Hold cash otherwise. If the P/E drops below 17, invest all accumulated cash at once.
- Portfolio 3 (P/E < 25): Same idea, but only invest when the Shiller P/E is under 25.
For example, during the 2008 crash:
- In Portfolio 2, we invested $2,500 when the Shiller P/E dipped below 17.
- In Portfolio 3, we invested $8,100 because fewer investments had been made beforehand.
Results: Which Strategy Performed Best?

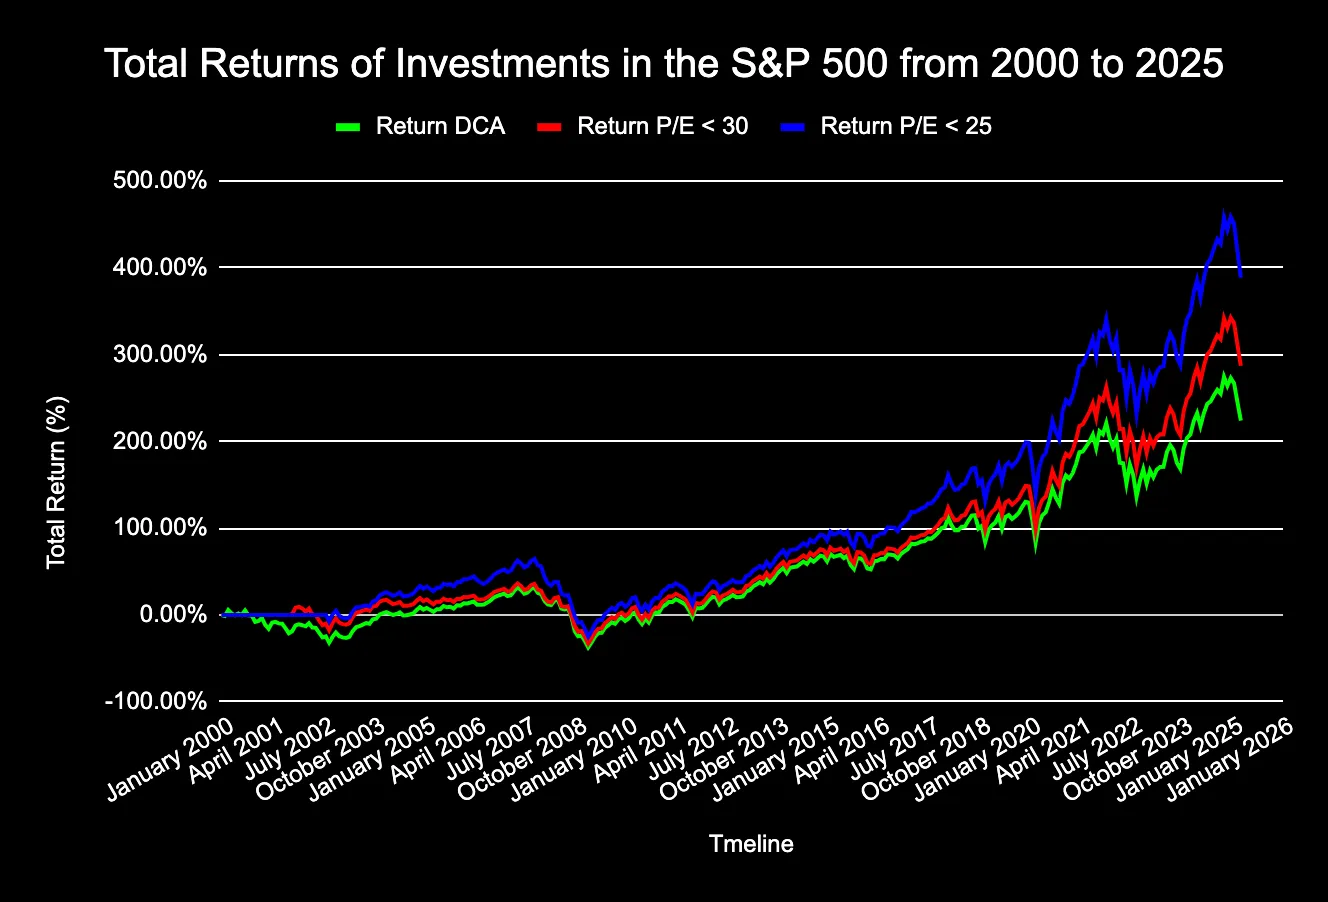
Figure 1: Comparing Total Returns
The results were eye-opening:
- DCA Portfolio: ~200% return
- P/E < 30 Portfolio: ~280% return
- P/E < 25 Portfolio: ~400% return
Clearly, timing the market based on valuation can significantly boost returns — almost double compared to simple dollar cost averaging.
But, there’s a catch…

Figure 2: Comparing Portfolio Values
When we look at the actual dollar value of the portfolios:
- DCA: $98,530.93
- P/E < 30: $92,917.78 (without cash), $99,317.78 (with cash waiting)
- P/E < 25: $86,009.13 (without cash), $98,809.13 (with cash waiting)
Because the market has been “overpriced” in recent years, the valuation-based portfolios have cash sitting on the sidelines.
After adjusting for cash, all three portfolios ended up almost identical in final value!
Why Timing the Market Isn’t as Easy as It Sounds
Trying to only invest when the market is undervalued sounds great in theory. You can potentially earn higher returns with less money invested.
The reality?
- Timing the market is extremely hard.
- Most of us don’t have the time, skill, or discipline to do it well.
- Missing opportunities because you’re “waiting” for a better valuation can cost you dearly.
How to Combine Dollar Cost Averaging and Market Timing
The “Hybrid” Strategy for Smart Investors
If you want the best of both worlds, you can build a hybrid approach:
- DCA $100 into the market monthly.
- Save another $100 into a “rainy day” or “opportunity fund.”
- When the market truly tanks (major crash), deploy extra cash.
This way, you build the habit of investing consistently but still have dry powder ready for those rare, deep buying opportunities.
Conclusion: Keep It Simple, Build the Habit
After running this 25-year simulation, the lesson is clear:
Your best chance of success is to make investing a consistent habit.
Dollar cost averaging works because it takes the emotion out of investing.
Building a habit of investing — no matter what the market looks like — is the real secret to long-term success.
Want more investing breakdowns like this?
👉 Subscribe to my newsletter for more real-world investing insights and strategies!
Disclosure: The content provided in this blog is for informational and educational purposes only and does not constitute investment advice. Always perform your own research and consult with a licensed financial advisor before making any investment decisions. For our full disclosure go here to our privacy page.
11 responses to “The Truth About Dollar Cost Averaging vs Market Timing (And Which One Wins)”
Awesome
Very good https://is.gd/N1ikS2
Awesome https://is.gd/N1ikS2
Very good https://is.gd/N1ikS2
Awesome https://is.gd/N1ikS2
Awesome https://is.gd/N1ikS2
Very good https://is.gd/N1ikS2
Good https://is.gd/N1ikS2
Awesome https://is.gd/N1ikS2
Good https://is.gd/N1ikS2
Very good https://is.gd/N1ikS2