
Your cart is currently empty!
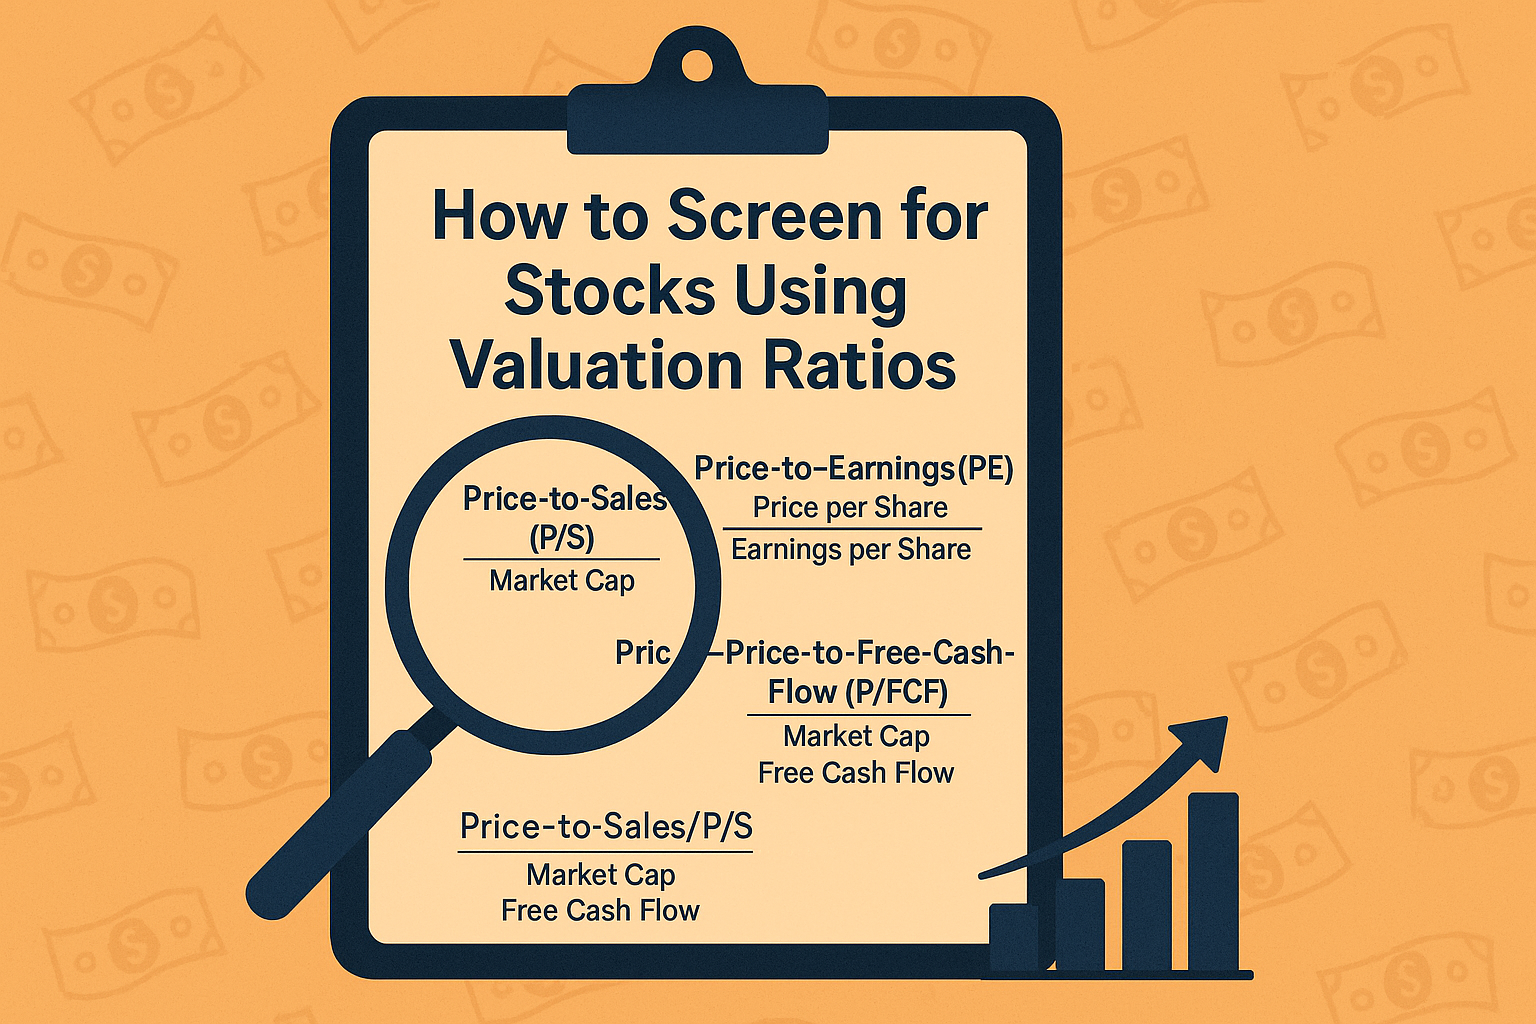
How to Screen for Stocks Using Valuation Ratios
Posted by:
|
On:
|
Finding new investment ideas doesn’t have to be complicated. In fact, one of the easiest ways to uncover potential stock opportunities is by using a stock screener.
Each month, I challenge myself to find a new stock for the MIJ Newsletter Portfolio—a real-money portfolio I fund monthly through dollar-cost averaging. But let me tell you, discovering a fresh idea every 30 days isn’t always easy. That’s where tools like Finviz.com come in handy.
Start with What You Know
As a newer investor, I keep things simple by focusing only on U.S.-based companies. International stocks are still outside my circle of competence—a concept popularized by Warren Buffett. He once said:
“You don’t have to be an expert on every company, or even many. You only have to be able to evaluate companies within your circle of competence… knowing its boundaries, however, is vital.”
That advice resonates with me. For example, I avoid investing in banks or insurance companies for now because I don’t fully understand how to read their financials. And that’s okay.
Screening Is an Art, Not a Science
Once I’ve defined my investing universe, I set up my screener. But here’s the thing: screening isn’t just about numbers—it’s about knowing what to look for and why.
I often start by screening for companies that appear undervalued based on a few core valuation metrics:
🔹 1. Price-to-Earnings (P/E) Ratio
What it tells you:
The P/E ratio compares a company’s stock price to its earnings per share (EPS). It shows how much investors are willing to pay for each $1 of the company’s profits.
Formula:
P/E=(Price * Total Shares Outstanding)/Earnings
Example interpretation:
- A P/E of 20 means investors are paying $20 for every $1 of earnings.
- A lower P/E (like 10–15) might indicate a stock is undervalued—but not always.
Why it matters:
The P/E ratio is one of the most widely used valuation tools. It’s useful for comparing companies in the same industry or spotting those that might be trading below their intrinsic value.
But be cautious:
- A low P/E could also mean the company has weak future growth prospects or financial issues.
- P/E can be manipulated through accounting tricks like share buybacks.
📌 Pro tip: Try comparing the P/E of a stock to its historical average or its peers—not just using it in isolation.
🔹 2. Price-to-Sales (P/S) Ratio
What it tells you:
The P/S ratio compares a company’s stock price to its total revenue. It’s helpful for valuing early-stage companies that might not yet be profitable (i.e., they don’t have a P/E ratio yet).
Formula:
P/S=(Price * Total Shares Outstanding) / Revenue
Example interpretation:
- A P/S of 1 means investors are paying $1 for every $1 of sales.
- A P/S < 1 is often considered a sign that the stock might be undervalued.
Why it matters:
Revenue is harder to manipulate than earnings, so the P/S ratio offers a cleaner look at the company’s top-line performance. It helps investors understand how much they’re paying for each dollar of sales.
That said, a low P/S doesn’t always mean a bargain. You still want to make sure the company is efficient and has strong margins—otherwise, strong sales might not translate into real profits.
📌 Best for: Growth companies or turnaround plays that are generating solid sales but aren’t yet profitable.
🔹 3. Price-to-Free-Cash-Flow (P/FCF) Ratio
What it tells you:
The P/FCF ratio compares a company’s market value to its free cash flow—which is the money left over after paying for operating expenses and capital expenditures.
Formula:
P/FCF=(Price * Total Shares Outstanding) / (Operating Cash Flow – Capital Expenditures)
Why free cash flow matters:
Free cash flow is the real cash a company generates. It’s what a business can actually use to:
- Pay down debt
- Reinvest in growth
- Buy back stock
- Pay dividends
Companies with strong, consistent free cash flow tend to be healthier and more financially flexible. A low P/FCF ratio suggests you’re paying less for each dollar of cash the company can use.
Example interpretation:
- A P/FCF of 10 means you’re paying $10 for every $1 of free cash the business generates each year.
- Lower numbers generally indicate better value.
📌 Best for: Mature, cash-flow-generating companies with consistent operating performance.
Putting It All Together
When I screen for stocks, I usually start with companies that are based in the United States. That keeps me within my circle of competence, especially as I continue learning. I avoid complex industries like banking and insurance for now, because their financials are harder to understand.
Next, I go to a stock screener like Finviz and begin setting up filters based on valuation ratios. I typically start with three key metrics: Price-to-Earnings (P/E), Price-to-Sales (P/S), and Price-to-Free-Cash-Flow (P/FCF).
The P/E ratio helps me compare how much I’m paying for a company’s earnings. I usually look for stocks with a P/E below 15, which can signal undervaluation. If I find several companies in the same industry trading at low P/E ratios, that might point to an entire sector being out of favor—potentially a great place to look for value.
The P/S ratio comes in handy when a company doesn’t yet have earnings. It tells me how much I’m paying for each dollar of revenue. Ideally, I look for companies with a P/S ratio below 1.
Finally, the P/FCF ratio gives me a sense of how much I’m paying for the company’s free cash flow—what’s left over after operating expenses and capital expenditures. Free cash flow is crucial because it allows a company to pay off debt, reinvest in its business, or return capital to shareholders.
By layering these filters together, I can narrow down a long list of companies to a few promising candidates worth deeper research. From there, I dive into their financial statements, business models, and long-term prospects before making any investment decisions.
Final Thoughts
Using valuation ratios like P/E, P/S, and P/FCF can help you cut through the noise and find companies that may be trading below their true value. But no single metric tells the whole story.
Think of these ratios as tools in your toolbox—not as automatic buy signals. Combine them with thoughtful research, and you’ll build the habits of a disciplined investor over time.
Disclosure: As an Amazon Associate, I earn from qualifying purchases. The content provided in this blog is for informational and educational purposes only and does not constitute investment advice. Always perform your own research and consult with a licensed financial advisor before making any investment decisions. For our full disclosure go here to our privacy page.
Leave a Reply