
Your cart is currently empty!
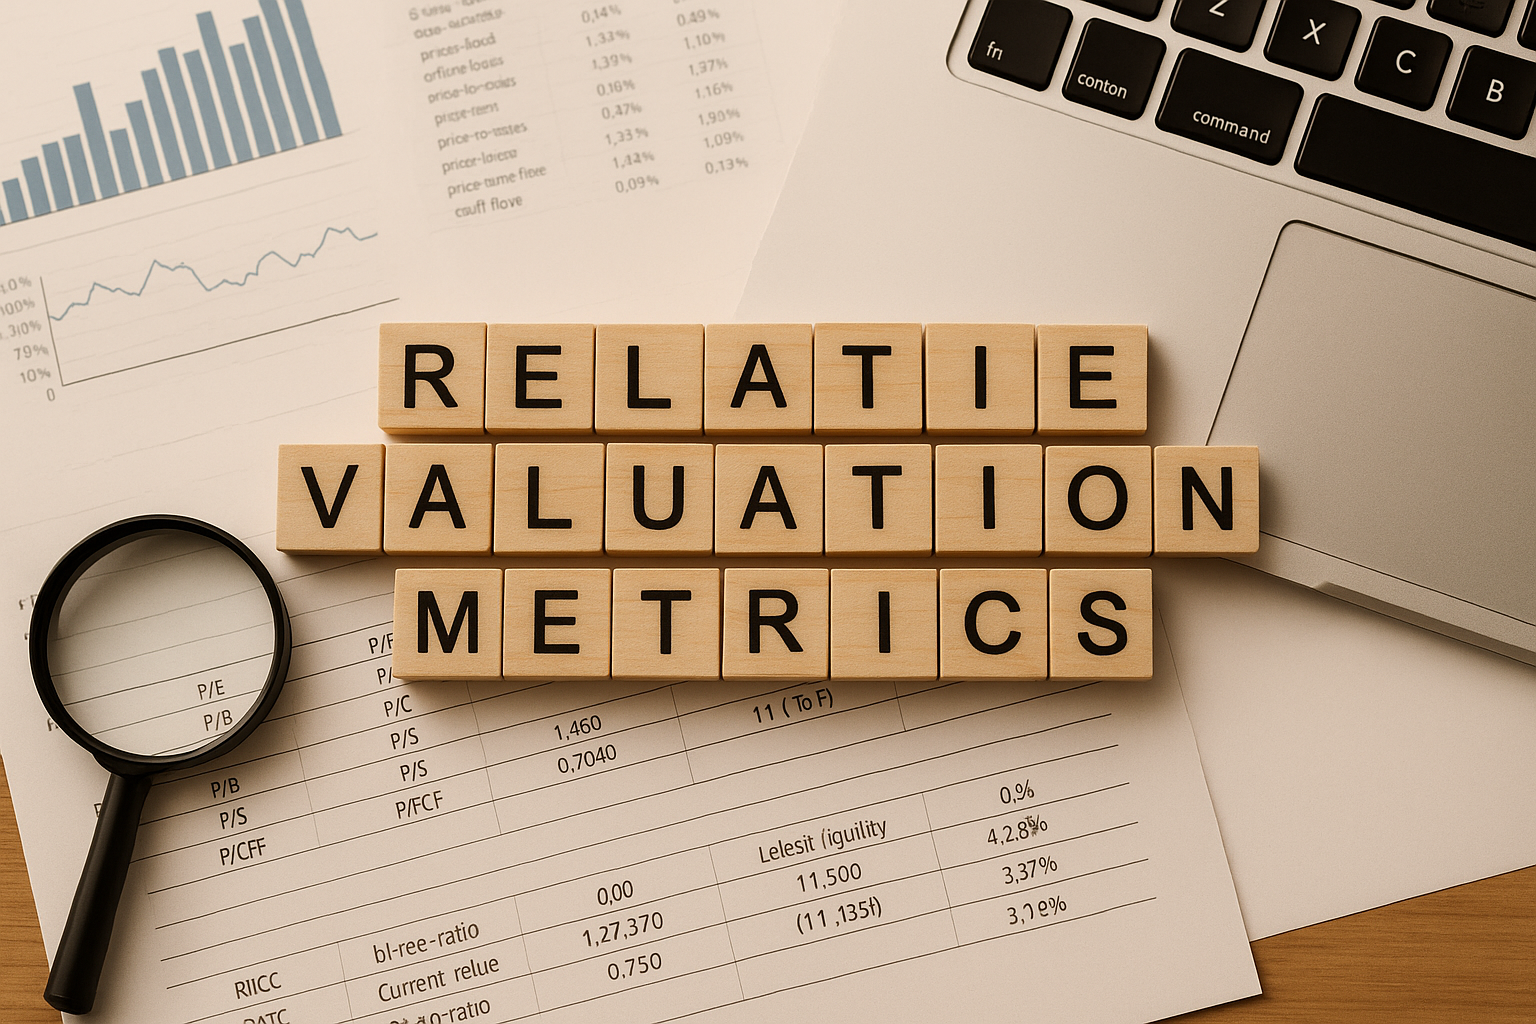
How to Use Relative Valuation Metrics to Screen, Compare, and Evaluate Stocks Effectively
Posted by:
|
On:
|
Relative valuation metrics can be powerful tools for screening companies, comparing a company to its past performance, and assessing it against its competitors. Let’s explore how to effectively use these metrics in each of these contexts.
- Screening for Companies
When screening for potential investments, online screeners like Finviz.com can be invaluable. These tools allow us to filter companies based on specific valuation metrics, making it easier to identify quality investment opportunities. Key metrics to consider include:
- Price-to-Earnings (P/E): Compares the company’s share price to its earnings per share.
- Calculation: (Price * Total Shares Outstanding) / Earnings
- A higher P/E indicates the company is trading at a premium to its earnings.
- Price-to-Book (P/B): Compares the share price to the book value per share.
- Calculation: (Price * Total Shares Outstanding) / (Total Assets – Total Liabilities)
- A higher P/B suggests the company is trading at a premium to its book value.
- Price-to-Cash (P/C): Compares the share price to the cash on hand.
- Calculation: (Price * Total Shares Outstanding) / Cash and Cash Equivalents
- A higher P/C indicates the company is trading at a premium to its cash position.
- Price-to-Sales (P/S): Compares the share price to the company’s revenue.
- Calculation: (Price * Total Shares Outstanding) / Revenue
- A higher P/S suggests the company is trading at a premium to its sales.
- Price-to-Free-Cash-Flow (P/FCF): Compares the share price to the free cash flow generated.
- Calculation: (Price * Total Shares Outstanding) / (Operating Cash Flow – Capital Expenditures)
- A higher P/FCF suggests the company is trading at a premium to its free cash flow.
By setting specific parameters for these metrics, we can identify companies that are trading at a discount or premium compared to their industry or historical averages.
- Comparing Companies to Their Past Performance
Another valuable application of these metrics is comparing a company’s current valuation to its past performance. This analysis can help determine if a stock is currently undervalued or overvalued relative to its historical norms.
In addition to valuation metrics, we can examine financial health indicators, such as:
- Debt-to-Equity (D/E): Compares the company’s debt level to shareholders’ equity.
- Calculation: Total Liabilities / Shareholders’ Equity
- A rising D/E ratio could signal increasing financial risk.
- Current Ratio: Measures the company’s ability to meet short-term liabilities.
- Calculation: Current Assets / Current Liabilities
- A low current ratio indicates lower liquidity.
- Quick Ratio: Similar to the current ratio but excludes inventory.
- Calculation: (Current Assets – Inventory) / Current Liabilities
- A low quick ratio can signal potential liquidity issues.
Monitoring these ratios over time can reveal whether a company is improving its financial health or taking on more risk.
- Comparing Companies Within the Same Industry
Relative valuation metrics can be highly effective for comparing companies in the same industry, particularly in assessing capital efficiency — how well companies utilize their assets, equity, and overall capital to generate returns. For example, comparing Wells Fargo to JPMorgan makes sense, while comparing Wells Fargo to Apple does not, as they operate in vastly different sectors.
Key metrics to consider in this context include:
- Return on Invested Capital (ROIC): Measures how efficiently a company generates profits from its invested capital.
- Calculation: (EBIT * (1 – Tax Rate)) / (Debt + Equity + Other Long-Term Funding)
- Return on Assets (ROA): Measures how efficiently a company uses its assets to generate profits.
- Calculation: Net Income / Average Total Assets
- Return on Equity (ROE): Measures how efficiently a company uses shareholders’ equity to generate profits.
- Calculation: Net Income / Shareholders’ Equity
- Return on Total Capital (ROTC): Measures how effectively the company uses its total capital to generate profits.
- Calculation: (EBIT * (1 – Tax Rate)) / (Total Debt + Total Equity)
These capital efficiency metrics provide valuable insight into how well companies are utilizing their resources to generate returns. By effectively using these relative valuation metrics, investors can gain a deeper understanding of a company’s financial health, capital efficiency, and overall market position. Whether screening for potential investments, assessing a company’s historical performance, or comparing businesses within the same industry, these tools can serve as powerful guides in identifying investment opportunities and making more informed decisions.
Disclosure: As an Amazon Associate, I earn from qualifying purchases. The content provided in this blog is for informational and educational purposes only and does not constitute investment advice. Always perform your own research and consult with a licensed financial advisor before making any investment decisions. For our full disclosure go here to our privacy page.
Leave a Reply